| Best CD Rates with FDIC |
Golden Cross Pattern Definition Larger Charts for S&P500 & DJIA |
 |
|
|
||
| Best CD Rates with FDIC |
Golden Cross Pattern Definition Larger Charts for S&P500 & DJIA |
 |
|
|
||
|
Definition
of the "Golden Cross" pattern:
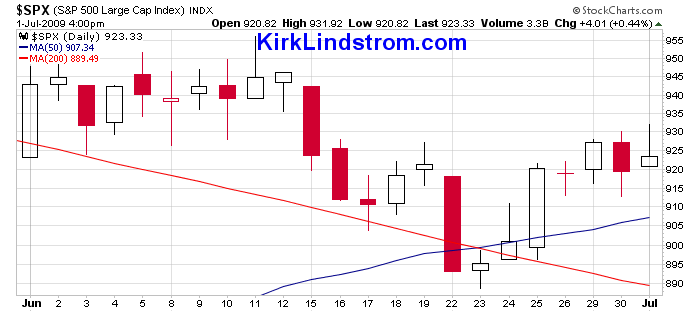
A golden crossing occurs when the shorter-term 50-day moving average,
MA(50) in the chart below, crosses the longer term 200-day moving
average, MA(200).
These patters usually confirm major changes of market direction.
 |
|
|
Typically, it is a
bullish signal for stocks when the
50-DMA crosses above the 200-DMA. Likewise, it is typically a
bearish signal for sotkcs whe the 50-DMA crosses below
the 200-DMA.
More on chart patterns:  The
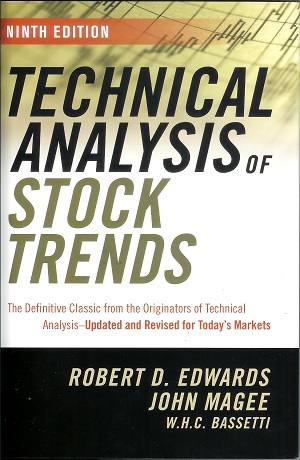
Bible for technical analysis, Technical Analysis of Stock Trends, The
Bible for technical analysis, Technical Analysis of Stock Trends, by Robert Edwards and John Magee Chapter 6 "Important Reversal Patterns" has many examples and details about the important "Head-and-shoulders" reversal pattern. Chapter 7 "Important Reversal Patterns - Continued" starts out with the "Head-and-Shoulders Bottom" reversal pattern. |
|
How to Get the Best CD Rates |