 Home: ForBestAdvice - Money - Investing - Stocks - TA:Technical
Analysis - Sentiment
- Investors' Intelligence Home: ForBestAdvice - Money - Investing - Stocks - TA:Technical
Analysis - Sentiment
- Investors' Intelligence |
||
 |
Investors' Intelligence Sentiment
Indicator Investors' Intelligence Bull Bear Survey More Sentiment Charts |
 |
|
|
||
| Key Sentiment Indicators |
||
| This
sentiment indicator is updated regularly in "Kirk
Lindstrom's Investment Letter."
=> FREE SAMPLE |
||
|
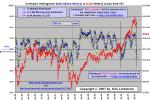
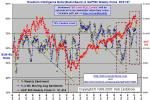
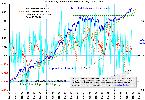
The “Investors
Intelligence Survey“ or IIS is one of the oldest
weekly
sentiment indicators used today. Charts of the
Investors’
Intelligence Survey (IIS) “Bulls over Bulls plus Bears” versus the
market are key tools for stock market technical
analysis or sentiment. The IIS
began in January 1963 by A.W.
Cohen and has been published every week ever since.
The IIS questions stock-market newsletter writers once a week to see if they were bullish or bearish on the stock markets in the near-term. Newsletter writers have a large following as a group and are thus considered “market experts.“ Cohen thought he could survey these "experts" to find out when it was best to be long or short the markets. Before he started, Cohen expected the best time to be long would be when the most advisers were bullish. Cohen was surprised to find out that the newsletter writers, just like average investors and speculators, were usually wrong at major turning points! Cohen found the best time to go long the stock markets was not when the most advisers were bullish, but when they were bearish! Cohen’s IIS survey turned out to be a wonderful contrarian indicator! Today, most who try to time the stock markets are aware of this contrarian indicator so it is not as useful as when it was first discovered. That is exactly how you would expect an efficient market to work! I find if I massage the data I can get useful information where change is more important than absolute levels. Of course, I keep the exact formula I use to myself because I don't want to aid the markets in becoming more efficient until I've taken advantage of what I've learned!
For a current reading on what the II Bull/Bear charts and many other sentiment indicators mean, subscribe to Kirk Lindstrom's Investment Newsletter.
Article: How to Get the Best CD Rates |
|
|
For a current reading on
what these sentiment indicators mean,
subscribe to Kirk Lindstrom's Investment Newsletter. 
DISCLAIMER:
Answers and our words are general in nature, are not meant as specific
investment advice, and do not necessarily represent the opinion of
anyone but forbestadvice.com.
Individuals should consult with their own advisors for
specific investment advice.
|
|
ForBestAdvice.com: Your place
for information and advice about anything and everything under the sun. |