| Best CD Rates with FDIC |
Death Cross Pattern Definition Larger Charts for S&P500 & DJIA |
 |
|
|
||
| Best CD Rates with FDIC |
Death Cross Pattern Definition Larger Charts for S&P500 & DJIA |
 |
|
|
||
Definition
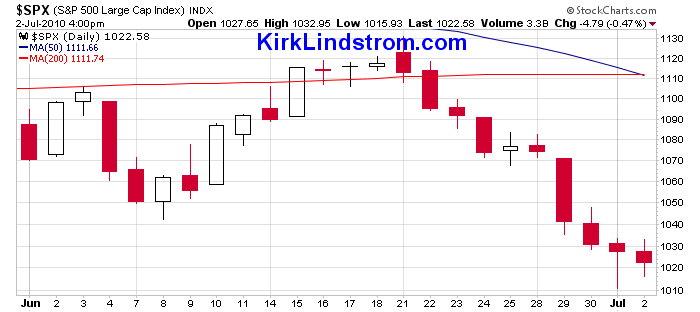
of the "death Cross" pattern:
A death cross occurs when the shorter-term 50-day moving average,
MA(50), crosses below the longer term 200-day moving average, MA(200),
on chart below. Not all death
crosses signal a new bear market and some occured after the bottom was
made. Chart created by KirkLindstrom.com WARNING: Not all death crosses
signal a new bear market and some occurred after the bottom was made.
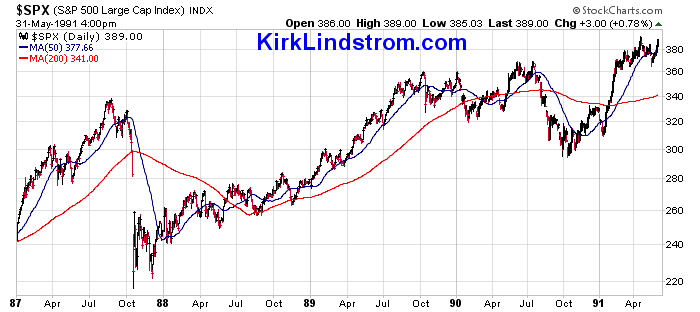
Another problem with this sort of "system" is markets that are range
bound can give many signals so you end up selling low and buying high
over and over.
For example, the death cross system missed the 1987 bear market, went to cash near the lows but after the bottom in 1987, got back in at a higher level in mid 1988 then lost more ground to "buy and hold" through whip-saw action between 1990 and 1991.  |
|
|
Typically, it is a
bullish signal for stocks when the
50-DMA crosses above the 200-DMA. Likewise, it is typically a
bearish signal for sotkcs whe the 50-DMA crosses below
the 200-DMA.
Also see "Golden Cross Pattern" More on chart patterns:  The
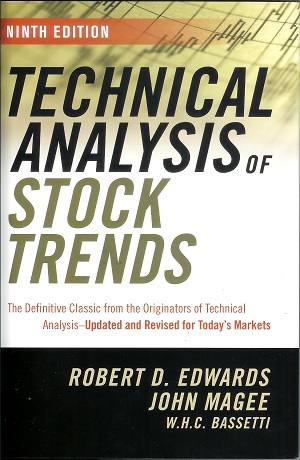
Bible for technical analysis, Technical Analysis of Stock Trends, The
Bible for technical analysis, Technical Analysis of Stock Trends, by Robert Edwards and John Magee Chapter 6 "Important Reversal Patterns" has many examples and details about the important "Head-and-shoulders" reversal pattern. Chapter 7 "Important Reversal Patterns - Continued" starts out with the "Head-and-Shoulders Bottom" reversal pattern. |
|
| For
Best Advice Sitemeter |
Money
Sitemeter |
To
advertise on this page, please contact advertising"at"forbestadvice.com |