 Home: ForBestAdvice - Money - Investing - Stocks - TA:Technical
Analysis - Sentiment
- State Street Investor Confidence Index Home: ForBestAdvice - Money - Investing - Stocks - TA:Technical
Analysis - Sentiment
- State Street Investor Confidence Index |
||
 |
State
Street Investor Confidence Index Investor Sentiment |
 |
|
|
||
| Key Sentiment Indicators |
||
|
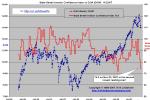
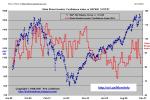
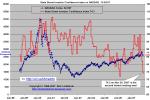
Charts of the State
Street Investor Confidence
Index plotted versus the Dow Jones Industrial Average (DJIA), S&P500
and NASDAQ composite index (COMPQ) are
key sentiment indicators for stock market technical analysis.
Contrarian theory states the time to buy is when fear and pessimism is
at a maximum since this usually occurs near market bottoms.
According to State Street, the “State Street Investor Confidence Index® measures the attitude of investors to risk. Developed by Harvard Professor Ken Froot and State Street Associates Director Paul O'Connell, the Index uses the principles of modern financial theory to model the underlying behavior of global investors. Unlike other survey-based confidence measures that focus on expectations for future prices and returns, the Index provides a quantitative measure of the actual and changing levels of risk contained in investment portfolios representing about 15% of the world's tradable assets.” |
|
|
For a current reading on
what these sentiment indicators mean,
subscribe to Kirk Lindstrom's Investment Newsletter. 
DISCLAIMER:
Answers and our words are general in nature, are not meant as specific
investment advice, and do not necessarily represent the opinion of
anyone but forbestadvice.com.
Individuals should consult with their own advisors for
specific investment advice
Top of Page ForBestAdvice.com: Your place
for information and advice about anything and everything under the sun. |