Home: ForBestAdvice - Money - Investing - Stocks - TA:Technical
Analysis - Sentiment
- ISE Home: ForBestAdvice - Money - Investing - Stocks - TA:Technical
Analysis - Sentiment
- ISE |
||
 |
ISE Sentiment
Indicator International Securities Exchange |
 |
|
|
||
| Key Sentiment Indicators |
||
|
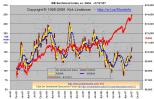
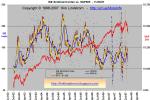
Charts of the International
Securities Exchange (ISE) Sentiment Index plotted versus the Dow Jones
Industrial Average (DJIA chart),
S&P500 (chart)
and NASDAQ composite index (COMPQ chart) are
key sentiment indicators for stock market technical analysis.
Contrarian theory states the time to buy is when fear and pessimism is
at a maximum since this usually occurs near market bottoms.
According to the ISE web site (http://www.ise.com/): The ISE Sentiment Index is a unique put/call
value that only uses opening long customer transactions to calculate
bullish/bearish market direction. Opening long transactions are thought
to best represent market sentiment because investors often buy call and
put options to express their actual market view of a particular stock.
Market maker and firm trades, which are excluded, are not considered
representative of true market sentiment due to their specialized
nature. As such, the ISEE calculation method allows for a more accurate
measure of true investor sentiment than traditional put/call ratios.
For a current reading on what the ISE sentiment index charts and many other sentiment indicators mean, subscribe to Kirk Lindstrom's Investment Newsletter. |
|