February 2, 2008: Article by Bob Norton. ECs (Editor's Comments): by Kirk Lindstrom
Bob Brinker LT Shadow Stock Market Timing Model Update for Feb. 02, 2008
The
"Bob Brinker Shadow Long Term Stock Market Timing Model" remains in
favorable territory as we move into February, 2008.
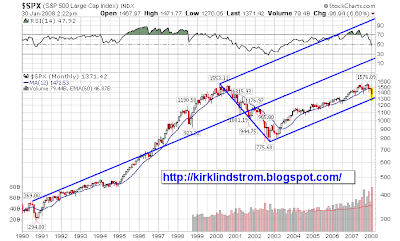
Bob Brinker subscribers must be aware that we came dangerously close to
breaking into bear market territory back on January 22nd with the
S&P (chart) closing at 1310. Indeed, We saw an intraday low of 1270 during January 23rd.
While the validity of the long term model remains intact, it is
understandable that many Bob Brinker watchers are perplexed by his
questionable mid 1400 level buying opportunity which, until recently,
had been in place for the past few months. My contention is that
during the Summer, Mr. Brinker did not properly assess the dangers of
the credit crisis and housing meltdown to the intermediate term health
of his timing model.
Valuation:
Standard & Poors has lowered their 2008 forward
operating earnings estimate to $99.21 as of 01/22/08. Evergreen
Investments holds to a more conservative number of $95.00.
The S&P Investment Policy Committee lowered their 2008 target from
1650 down to 1560. Evergreen Investments has likewise scaled back
their target to 1550 from 1625. Wachovia Bank also sees upside
potential in the mid 1500 range.
Yesterday's S&P close at 1395 divided by an earnings midway point of $97 gives a current p/e of only 14.38.
Dividing 1560 by my midway earnings number of $97 would yield a p/e of
about 16. The 16 p/e is the low end of Bob Brinker's 16-17 times
earnings.
The Morningstar Valuation Graph is showing undervalued readings which are the most extreme levels reached in the past 12 months.
The 10 year Treasury is presently at 3.60% (06/07 = 5.25%.) The
relationship of the 10 year bond (3.60 %) to the S&P earnings yield
(1/14.38) = .5.17. This is highly indicative of the superior
earnings potential of equities.
EC:
This indicator is often called the "Fed Model" which compares the
earnings yield (one over the price to earnings ratio) of the S&P500
with the 10 year Treasury. For example, 1/14.53x100% is
6.7%, nearly 60% above the yield on the 10-year treasury.
Many think the market is over valued when the indicator is at or above
1.0 so lower is better.
The valuation indicator is decidedly BULLISH.
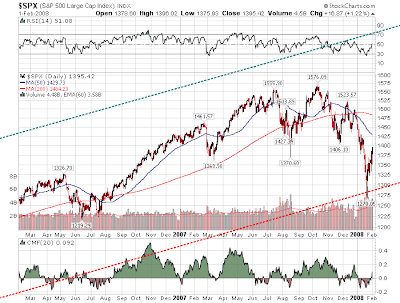
EC: The S&P500
closed Friday 02/01/08 at 1,395.42. S&P estimates operating earnings for 2007 and 2008 (as of 1/16/08) will come in at $77.06 and
$101.24, respectively. The current PE is then 1,395.42 / 77.06
or 18.01 (2007 earnings came down about $10 last month due mostly
to losses in the financial sector and General Motors.) Bob
Brinker, and most others not expecting a melt-down in the financial
sector, had expected much higher earnings for 2007.
If you apply today's PE of 16.5 to 2008 earnings, we get an estimate for 2008 of
16.5 x $101.24 = $1,670 for the S&P500, 19.7% higher than
Friday's close. I cover this in more detail every month in "Kirk's Investment Newsletter."
|
|
Monetary:
1/14/08 M2 liquidity readings continue to deteriorate.

7440/7075 = 5.15% - 4.10% (CPI) = 1.15 inflation adj growth rate.

M2 rate of expansion has contracted to the point where it  is substantially below the final 2007 CPI of 4.1% and core CPI of 2.4%.

The January 2008 reading on the PCE stands at 3.5% year over year, with the core rate holding steady at 2.2%.
EC:
Bob Brinker tracks the growth and inflation adjusted growth of
M2. He likes to see M2 growting better than the rate of inflation
for higher stock market prices. Too much monetary growth leads to
inflation so the FOMC has to walk a tight rope to get this "just right."
In spite of concerns raised last month by some of my sources, the Federal Reserve has elected to push inflation concerns to the back burner in order to tackle U.S. recession fears head-on.  The Federal Funds rate now stands at 3.00%, resulting from the recent unannouced cut of 75 basis points and the 50 point cut coming out of the just-concluded January Fed meeting. The 3.00% Fed Funds rate is finally below the 3.60% yield on the 10 year bond.  The Fed needs to continuing fostering a return to a normalized yield curve.

The 2008 economic projections from Wachovia Bank continue to hold that the CPI should moderate back toward the mid 3% range with the Federal Reserve favored PCE deflator staying below the level of 2.4%.

Although inflation is not the primary concern right now, by siding with the need to stimulate the economy over future inflation worries, the Federal Reserve is running the risk of creating heightened inflation prospects after the economy eventually picks up steam. The comments from Evergreen Investments last month about the Fed possibly having to do an about face to battle inflation in the future are worth remembering....perhaps not now, but maybe 9-12 months from now.
EC: Make sure you read: January 25, 2008:
A WINDOW OF OPPORTUNITY: A Special Report
ECRI says we can afford to
stimulate the economy wtih lower rates and "money from Ben Bernanke
Helicopters" because their leading index of future inflation (US-FIG)
is still low. I cover this in more detail every month in "Kirk's Investment Newsletter."
With the slowing economy, the Fed is expected to continue with rate
easing, thus allowing me to conclude that Fed policy is a positive for
stock market recovery in the months ahead.
For now, with the Fed on a campaign to forestall recession and bring
about a normalization of the yield curve, monetary policy is heading in
the required direction for the intermediate term improvement in equity
market prospects.
This indicator is BULLISH
Sentiment:
Investor's Intelligence Survey (bulls/bulls+bears) 1/30/08
stands at .555. The survey has staged a SHARP retreat from Bob
Brinker's caution level of .700 which was recorded during the last two
weeks of december.
A recent reading of the 60 day put/call ratio stood at 1.03. The 10 day
put/call ratio comes in at 1.04. Both numbers are suggesting that a
healthy amount of fear exists in the equity markets.
The current sentiment picture is a welcomed development as the S&P 500 continues to define a bottom.
EC: The
60 day moving averate of the Put/Call ratio was under 0.50 in early
2000 when Bob Brinker's timing model signaled sentiment was too
bullish. A reading of 0.50 or less means two bullish call options were
bought for every bearish put option.
EC: More Sentiment Indicators
This indicator is still BULLISH.
Economic:
Indicators continue to leave us watching and waiting to
see if the US Economy narrowly avoids recession territory. In support
of positions held by ECRI and Northern Trust which still (barely) call
for a miss on recession, Wachovia Bank is calling for GDP expansion as
follows:
1st Qtr=0.4%
2nd Qtr=1.4%
3rd Qtr=2.6%
4th Qtr=2.9%
This would average out to be 1.8% for the year and is in keeping with Northern Trust 1.7% and Evergreen investments 2.0%.
The initial release of 4th quarter 2007 GDP on January 30th came in at
0.6%. This number is expected to be revised upward and it
presently leaves the 2007 GDP growth rate around 2.56%.
Evergreen Investments sums up the economic outlook by saying:
"The trends of employment and income gains will help support GDP growth
of approximately 1.0% (actual 0.6%) for 4th quarter 2007 and 1st
quarter 2008. Recessions have historically been a consequence of tight
monetary policy and soaring inflation.
The combination of
extraordinary monetary/fiscal stimulus, capital investment, export
growth, and government spending in an election year may limit the
potential for recession as 2008 progresses."
The announcement of negative job growth yesterday already casts a bit
of doubt on the above statement.....we'll have to watch and wait.
The economic indicators remain NEUTRAL.
EC: In addition to ECRI, I give a lot of weight to UCLA's Anderson School of Business and ISI Group's chairman, Ed Hyman. None of these three have called for a recession. Ed Hyman continues to win awards for the top economist in the US. Ed Hyman said on on Jan. 14th, "We don't expect a recession, but we do expect
slow growth and higher unemployment."
Summary Comments:
The Bob Brinker "Shadow" Long Term Stock Market Timing Model continues to have 3 indicators bullish and one neutral.
Bob Brinker's methodology, while technically still valid as we have yet
to break below 1252 on the S&P (a 20% retreat from from the October
9th closing high of 1565), failed to provide adequate guidance in the
face of the credit crisis and sub-prime mortgage meltdown. On a closing
basis, the January 22nd S&P 1310 was 16.3% off the October 9th 1565
close. The timing model (or Brinker's interpretation of the signals)
was saved from ruin by 3.7%!!!
In this presidential election year, preventing recession is job #1 for
the candidates, Congress, and the Federal Reserve.....and is a key as
to why I believe that we have a decent shot at a stock market recovery.
I believe we are in the process of forming a bottom in the S&P,
possibly within the general level of 1275-1300. The fact that we are
presently at 1395 is great news, but it would seem too easy to conclude
that we would move straight up to the mid 1500s without some probing
and testing of the recent bottom.
Watch for a test of the 1275-1300 level. Hopefully selling pressure
will be exhausted, and will confirm the march toward the mid 1500
recovery area later in the year.
Perhaps Bob Brinker may issue yet ANOTHER buying opportunity in this retest area!
For the intermediate term (now through the election season), I believe
that a return to levels north of 1500 should be used for assessing
individual tolerance for risk in the equity markets as we move into
2009.
In short, the next return to this level may be the LAST one investors
receive if inflation becomes a serious concern after the elections. A
negative outlook for inflation, if it materializes later on, will
present a very challenging environment for market appreciation in 2009
and beyond.
Comments are welcomed and always appreciated at our Bob Brinker Discussion Forum at Facebook's Investing for the long term group.
Bob Norton
EC: Waiting for a bottom call is a coin toss at best. If you study Brinker's "gift horse" and
"MOABO" buy levels through history, about half of them hit and half
miss. Bob Brinker issued a buy under 1380 in 2007 after the market
rose above that level to go on and make new highs. When the market was
in the mid 1500's without a drop again below 1380, Brinker raised his
lump sum buy level to the"mid 1400's. After that, the market crashed
to the "mid 1200's or about 18% from intraday peak to bottom, so far.
Brinker took that mid 1400's buy level off via a special bulletin when
the market was at 1325. At that price, he said to once again dollar
cost average while he attempts to "identify a bottom." I prefer to use
asset allocation which had me taking profits when the market was in the
1500's and has had me buying stocks these past weeks at lower than
current prices.
 Click the image and scroll down on the Blog to see the image full sized
If you
want updates on what Brinker is saying on Moneytalk delivered to your email box, often within 24 hours after
Sunday's show, then send us a note at TalkAboutMoney@gmail.com and ask to get on our mailing list.
Please discuss Bob's article on our Bob Brinker Discussion Forum at Facebook's Investing for the long term group.
|