Home: ForBestAdvice - People - Bob Brinker Fan Club - Shadow Stock Market Timing Model Update 03/01/08
|
|
||

|
Bob Brinker Shadow Stock Market Timing Model Update 03/01/08 A Special Report by Bob Norton for the Bob Brinker Fan Club | Highest CD Rates |
|
|
||
|
|
If you want updates on what Brinker is saying on Moneytalk delivered to your email box, often within 24 hours after Sunday's show, then send us a note at TalkAboutMoney@gmail.com and ask to get on our mailing list. ==> Highest Yield CDs with FDIC <== |
|
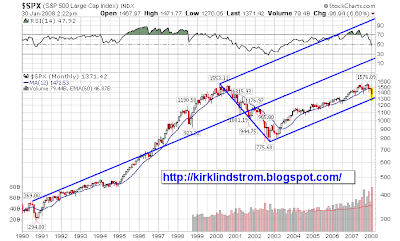
March 1, 2008: Article by Bob Norton. ECs (Editor's Comments): by Kirk Lindstrom Bob Brinker LT Shadow Stock Market Timing Model Update for March 1, 2008 The "Bob Brinker Shadow Long Term Stock Market Timing Model" remains in favorable territory as we move into March, 2008. On February 6th, we saw the S&P (chart) close at 1326, followed by an intraday low of 1316 on February 7th. This occurred on volume 30% lower than that associated with the January 22nd close of 1310. Yesterday Feb 29th, S&P closed down sharply at 1330, AGAIN, on volume 30% lower than during the January 22nd time frame. The bottom formation process which I spoke of last month appears to be well underway. Valuation: With the S&P at 1330
and using an average S&P earnings estimate of $97 (Evergreen
Investments $95 and S&P 98.99), we get a p/e of 13.71. Using the
low end of Bob Brinker's 16-17 times earnings suggests upside potential
of 1552 on the S&P as we move through the Fall elections and into
2009.
The 10 year Treasury is presently at 3.53% (06/07 = 5.25%) The relationship of the 10 year bond (3.53 %) to the S&P earnings yield (1/13.71) is 3.53/7.29 = 0.484. If money is supposed to go where it is treated the best, by virtue of valuation, that place has to be equities. EC:
This indicator is often called the "Fed Model" which compares the
earnings yield (one over the price to earnings ratio) of the S&P500
with the 10 year Treasury. For example, 1/13.71x100% is
7.3%, nearly DOUBLE the yield on the 10-year treasury.
Proponents of "The Fed Model" think the market is over valued when the
indicator is at or above
1.0 so lower is better.
The valuation indicator is decidedly BULLISH. EC: The S&P500
closed Friday 02/2/08 at 1,330.63. S&P estimates operating earnings for 2007 and 2008 (as of 2/26/08) will come in at $84.08 and
$98.63, respectively. (2007 is still an estimate as not all data is in.)
The current PE is then 1,330.63 / 84.08 or 15.8 If you apply today's PE of 15.8 to 2008 earnings, we get an estimate for 2008 of 15.8 x $98.63 = $1,558 for the S&P500, 17.2% higher than Friday's close. I cover this in more detail every month in "Kirk's Investment Newsletter." I agree with Bob N. that valuation is quite bullish as long as a recession doesn't cause analysts to lower earnings estimates for 2008 and 2009. | ||
| Sentiment: Investor's Intelligence
(Bulls/Bulls + Bears) has now been under .600 for six consecutive
weeks! This has to be considered an important indication of
greatly heightened bearishness within the investment letter-writing
community.
EC: II-BBS:
Investors’ Intelligence Bull Bear survey:
II Charts and
Info
AAII: American Association of Individual Investors Bull/Bear Index: Charts and More Info Both the 10 day and 60 day put/call ratios are above 1.00. And the NYSE reading of the ARMS index, although still negative and indicating more action in declining stocks, is improving at significant rate. EC: The
60 day moving average of the Put/Call ratio was under 0.50 in early
2000 when Bob Brinker's timing model signaled sentiment was too
bullish. A reading of 0.50 or less means two bullish call options were
bought for every bearish put option.
EC: More Sentiment Indicators This indicator is still BULLISH. Monetary: As of 2/11/08, M2 liquidity readings continue to deteriorate. M2 growth rate is
substantially below the recently updated headline inflation rate.
Continued Federal Reserve easing is definitely warranted to foster
improvement in this indicator. Although the Federal Reserve is
committed to stimulating economic growth versus worrying about
inflation, getting money to actually circulate through the financial
system is another matter. The un-thawing
of the credit markets may take some time. EC:
Bob Brinker tracks the growth and inflation adjusted growth of
M2. He likes to see M2 growing better than the rate of inflation
for higher stock market prices. Too much monetary growth leads to
inflation so the FOMC has to walk a tight rope to get this "just right."
This indicator is NEUTRAL
EC: Bob
N. has the Monetary Indicator as neutral in recognition that the Fed is
trying to improve the situation. I have it as bearish because
cutting rates seems to only be stimulating more inflation while long
term rates people get for mortgages are not coming down. The Fed is
willing to accept this for now because they feel it is easier to cut
inflation later by raising rates than it is to save an economy that
falls into a deflationary depression which we could get if all the
banks were to stop lending money.
Currently monetary growth is tight. The Federal Reserve has cut short term rates but mortgage rates for 30 year mortgages have not followed while at the same time lenders have increased their lending standards so only the very best credit risks can get good loans. See: Best Mortgage Rates for the current update of National Overnight Averages of mortgage rates. For this week the average 30-year fixed rate mortgage is 5.94%, UP from 5.76% the week before! Also, the 5/1 ARM mortgage usually follows short term Treasuries and the LIBOR Rates, but they too remain high at 5.17%, up from 5.02% the week before! Inflation needs to come down for long rates to drop. Lowering the Fed Funds rate is inflationary so lenders will want assurances inflation is contained before they will accept lower rates. The bear market in housing has been made worse by a meltdown in the credit markets so I currently have the "Monetary Policy Indicator" as BEARISH. Economic: The outlook continues to be rated neutral as the updated December GDP number remained unchanged at 0.6%.
From Northern Trust: "The
party is ending. Home prices are falling, home foreclosures are
soaring, and mortgage lenders are requiring more than a pulse in order
to qualify for a loan."
Northern Trust feels that the eventual economic recovery will be anemic in spite of aggressive action on the part of the Federal Reserve. They cite the probability that losses in the financial sector will spread beyond residential mortgages to include credit card debt, auto loans, commercial mortgages, and high yield (Junk) securities. The liquidity which the Fed is trying to pump into the system will not flow through the economy rapidly. Both Evergreen Investments and Wachovia Bank feel that all of the stagflation talk circulating within the financial press may be a bit premature. Wachovia has said that the "Stagflation Geeks" see rising commodity prices as indications of the unwelcome combination of slow growth and nagging inflation. However, they feel that more time is needed to evaluate the effects of slow growth on overall demand. They are standing by their prediction that inflation will begin to moderate in the 2nd half of the year. Evergreen points out that, historically, wages have represented nearly 70% of total business costs and that the Employment Cost Index has only risen by 3.3% over the past 12 months. Inflation pressures are rising, but are doing so from extremely low levels of recent years. The CPI has only recently achieved its historically average annual growth rate of 4%. With the Producer Price Index up 7.4% (2.3% ex food/energy) and the PCE at 3.7% annual (core PCE 2.2), we need to see hard data in the upcoming quarters to confirm easing in the various inflation indicators. The economic indicators remain NEUTRAL. EC: In addition to ECRI, I give a lot of weight to UCLA's Anderson School of Business and ISI Group's chairman, Ed Hyman. None of these three have called for a recession. Ed Hyman continues to win awards for the top economist in the US. Ed Hyman said on on Jan. 14th, "We don't expect a recession, but we do expect
slow growth and higher unemployment."
Summary Comments: EC: Bob Norton's i "Shadow" Long Term Stock Market Timing Model has 2 indicators bullish and 2 neutral. Last month he had 3 indicators bullish and 1 neutral.
Bob Brinker also
examines the health of Mr. Market by way of the "Five Root Causes of a
Bear Market". Please read "Bob Norton's Interpretation of Bob Brinker's 5 Root Causes of a Bear Market" for his latest update. Bob Norton EC:
Thanks Bob for another excellent
analysis.
If you want updates on what Brinker is saying on Moneytalk delivered to your email box, often within 24 hours after Sunday's show, then send us a note at TalkAboutMoney@gmail.com and ask to get on our mailing list.
|
||
|
|
| Top of Page |
|
|
|
|
| ForBestAdvice.com: Your place for information and advice about anything and everything under the sun. |
||||
|
Updated 03/01/08 |
|
bbfc sitemeter |
To advertise on this page, please contact advertising@forbestadvice.com |
|
|
ABC's
Market Timer Bob Brinker helps Moneytalk listeners reach the "Land of
Critical Mass." This is the place for Information about Bob Brinker, Bob Brinker's Stock Market
Timing Model and Marketimer Newsletter. The photo of Bob Brinker is from a 2000 appearance at a charity event. |